AWS Big Data Blog - OpenSearch Serverless Monitoring
AWS Big Data Blog - OpenSearch Serverless Monitoring
Guide to Setting Up Amazon OpenSearch Serverless Monitoring with CloudWatch
by Urmila Iyer and Parth Shah on September 24, 2025 in Advanced (300), Amazon CloudWatch, Amazon OpenSearch Service, Monitoring and observability, Serverless, Technical How-to Permalink Comments Share
Amazon OpenSearch Serverless simplifies the deployment and management of OpenSearch workloads by automatically scaling based on your usage patterns. This service considers key metrics such as shard utilization, storage consumption, and CPU usage while maintaining millisecond response times, with the simplicity of a serverless environment.
While OpenSearch Serverless automatically handles scaling, implementing robust monitoring is still crucial for understanding usage patterns, optimizing costs, ensuring performance, and maintaining reliability. Proactive monitoring helps organizations detect critical issues with applications or infrastructure in real-time and quickly identify root causes.
This article is part of a series on monitoring Amazon OpenSearch services, focusing on OpenSearch Serverless workloads and deployments. In this article, we explore commonly used CloudWatch metrics and alerts for OpenSearch Serverless, guide you through the process of selecting appropriate metrics, setting proper thresholds, and configuring alerts. This guide will provide you with a comprehensive monitoring strategy that complements the serverless nature of your OpenSearch deployment while maintaining full operational observability.
Key Benefits of CloudWatch Monitoring for OpenSearch Serverless
Implementing CloudWatch monitoring for OpenSearch Serverless collections provides several key benefits:
- Near real-time performance monitoring: CloudWatch provides near real-time monitoring capabilities, allowing you to track the performance of OpenSearch Serverless collections during operation. This immediate observability enables quick detection of anomalies or performance issues, helping with timely response to potential problems.
- Efficient error diagnosis: You can quickly identify and resolve common errors without complex log analysis. For example, by monitoring ingestion request errors, you can proactively mitigate bulk indexing request failures.
- Proactive alert system: Use CloudWatch alert functionality combined with Amazon Simple Notification Service (Amazon SNS) to set up custom alerts. By defining specific thresholds for critical metrics, you can receive immediate notifications via email or SMS when your OpenSearch Serverless collections approach or exceed these limits.
- Comprehensive historical analysis: CloudWatch’s data retention capabilities enable in-depth historical analysis. This helps you identify long-term performance trends, recognize recurring patterns in resource usage, and optimize workload distribution based on historical insights.
Solution Overview
Understanding which metrics to monitor in OpenSearch Serverless helps optimize system performance and reliability. This guide explains the key metrics to monitor, their significance, how to determine appropriate thresholds, and step-by-step procedures for setting up alerts. Understanding these fundamentals will help you establish effective monitoring for OpenSearch Serverless collections and maintain optimal performance and reliability.
Prerequisites
Before getting started, you need the following:
- An AWS account that provides access to AWS services.
- An OpenSearch Serverless collection.
Recommended CloudWatch Metrics and Alerts for OpenSearch Serverless
The table below summarizes key CloudWatch metrics for OpenSearch Serverless, including recommended alert thresholds, metric descriptions, and applicable workload types.
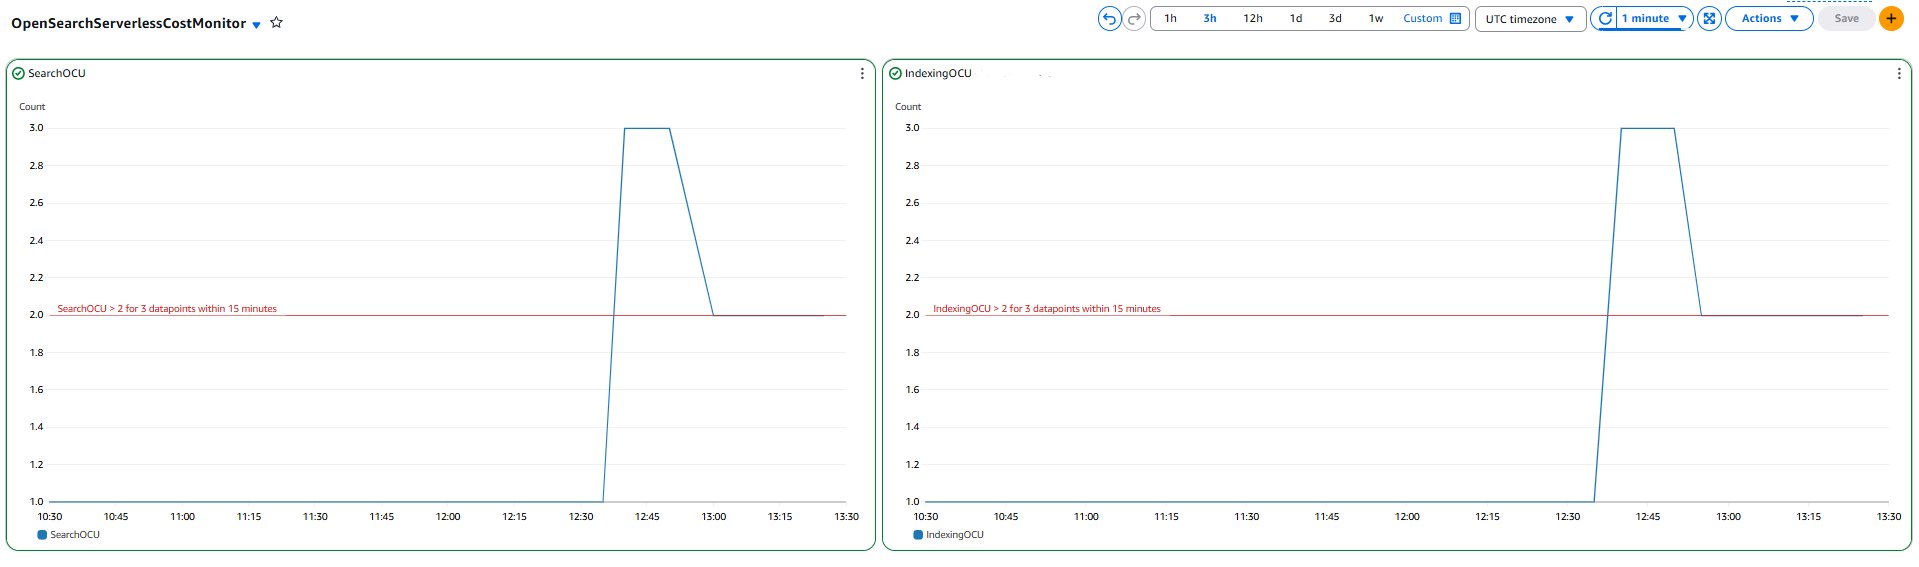
 CloudWatch metrics dashboard for OpenSearch Serverless
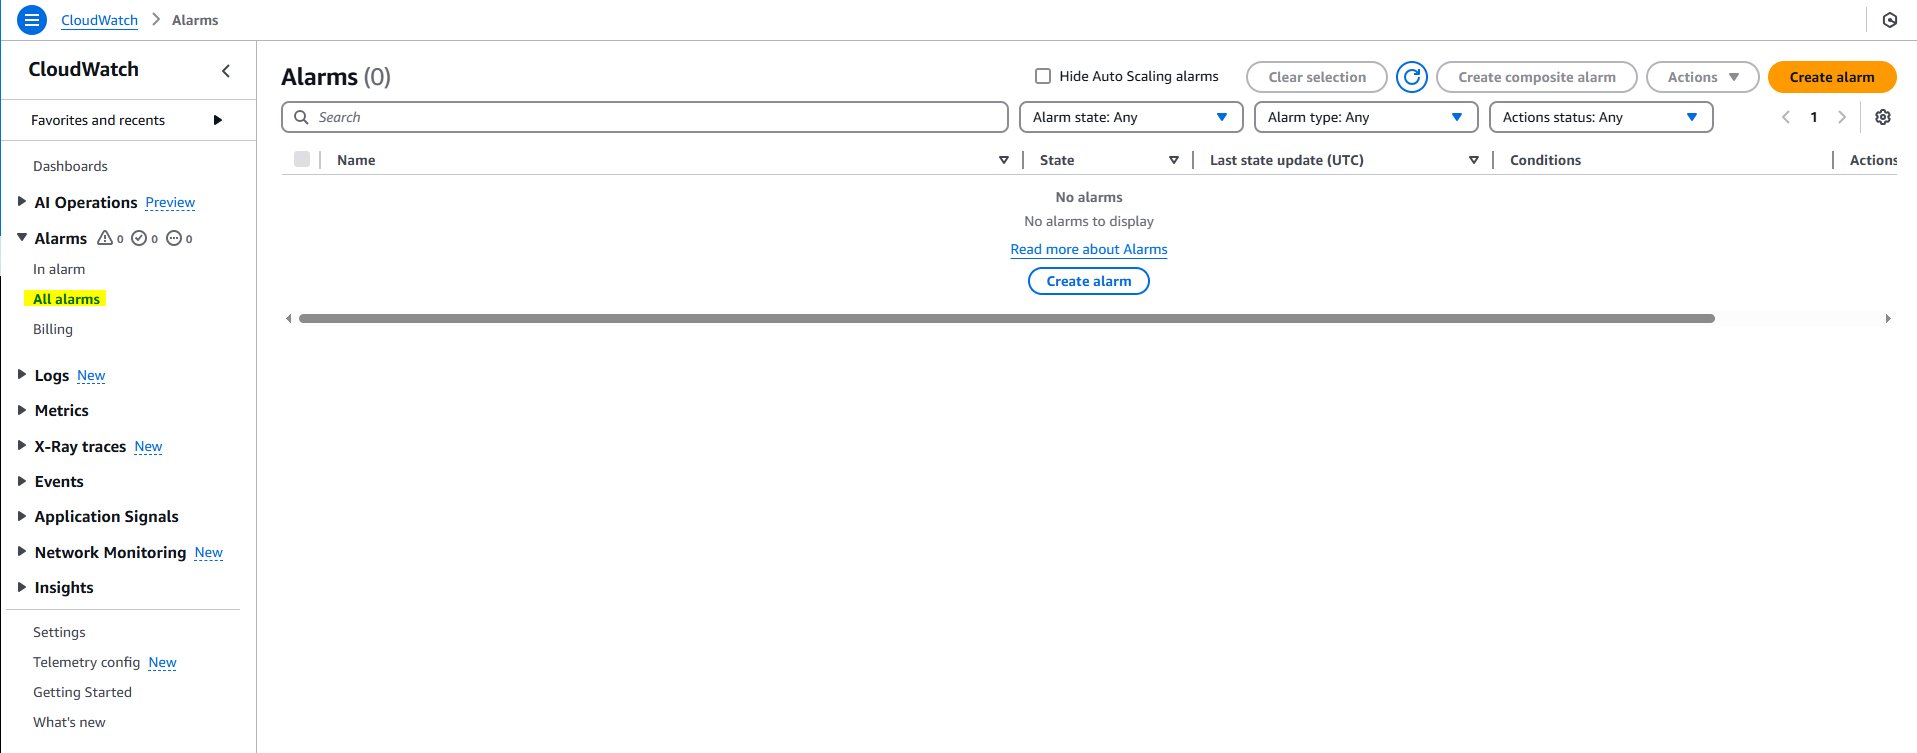
 Setting up monitoring alerts
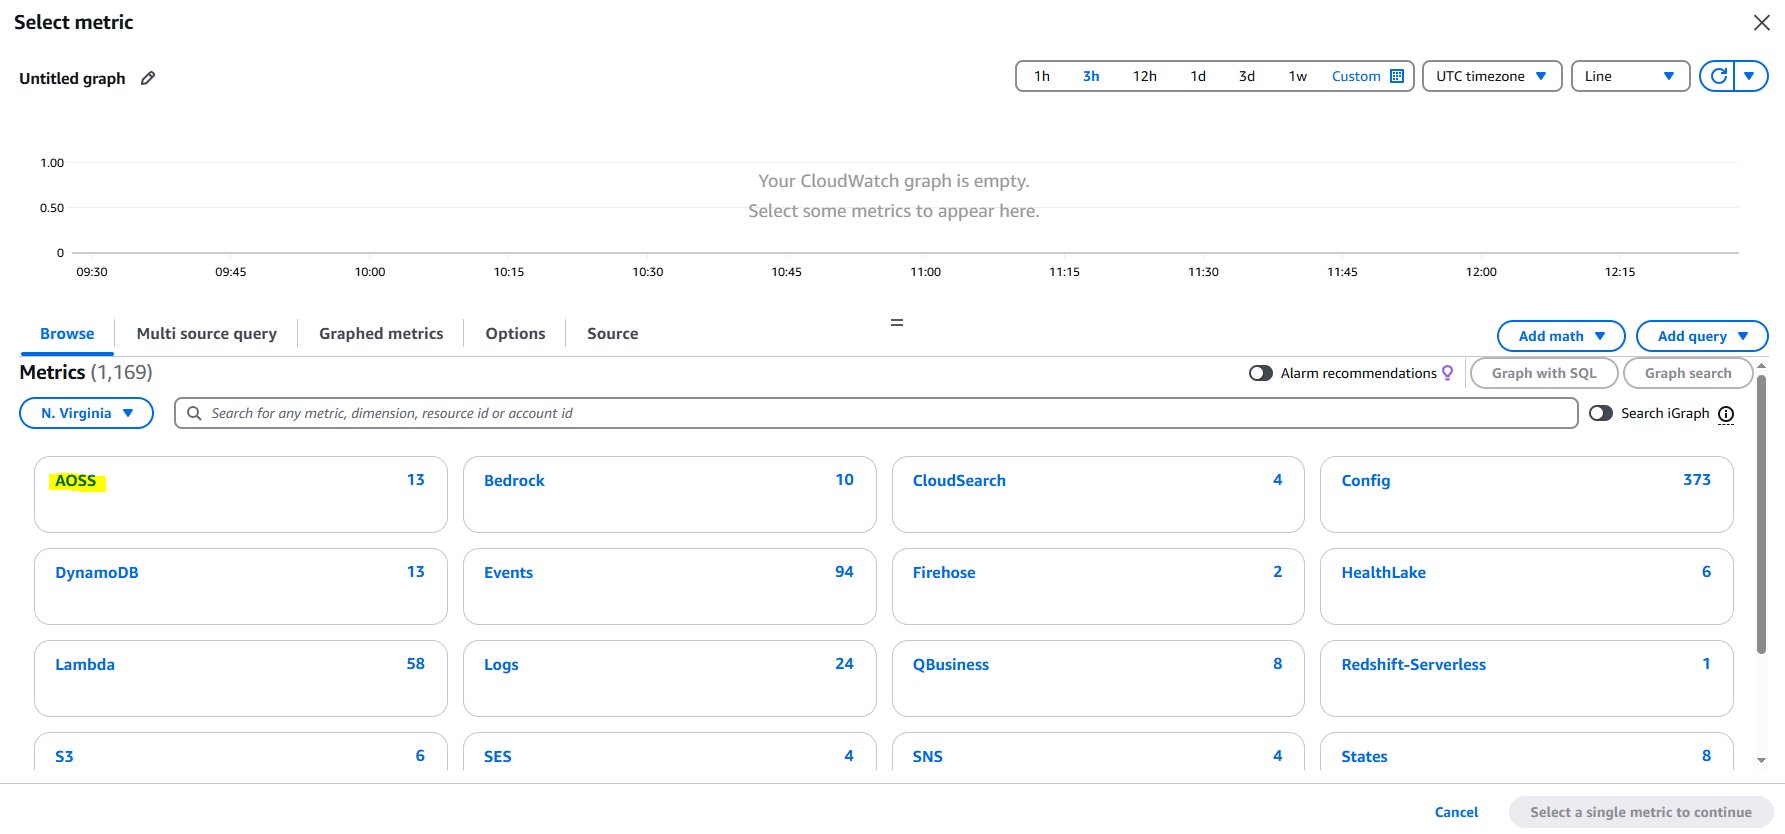
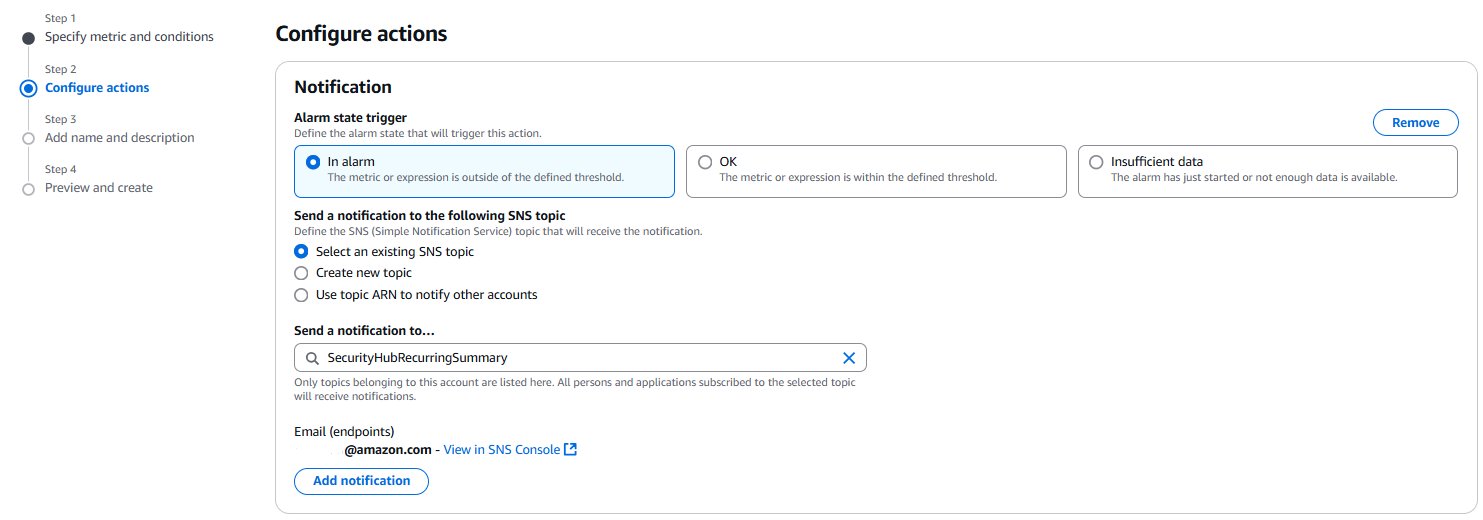
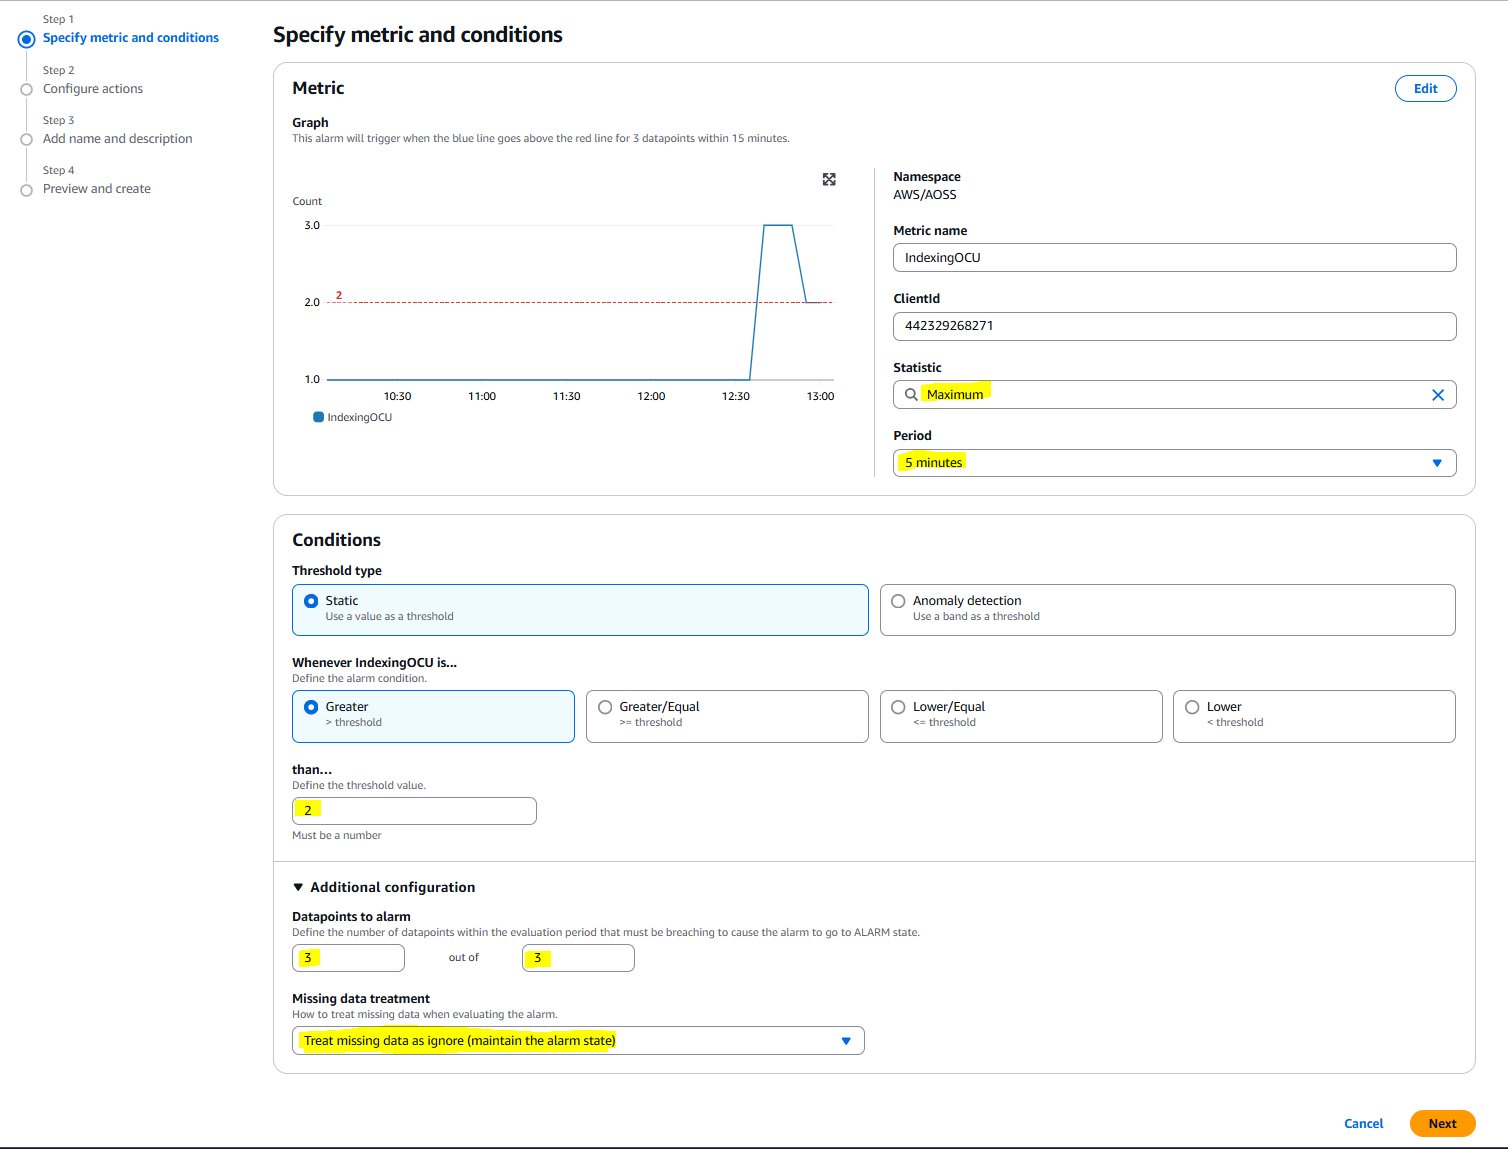 Configuring CloudWatch alarms
 Performance metrics visualization
 Historical data analysis dashboard
Authors
 Urmila Iyer
 Parth Shah