Integrating AWS X-Ray
Objective
Use AWS X-Ray to trace and inspect the entire processing flow of API Gateway → Lambda → DynamoDB.
X-Ray helps visualize traces, latency, errors, and segments/subsegments to ensure the API behaves correctly and efficiently.
Implementation Steps
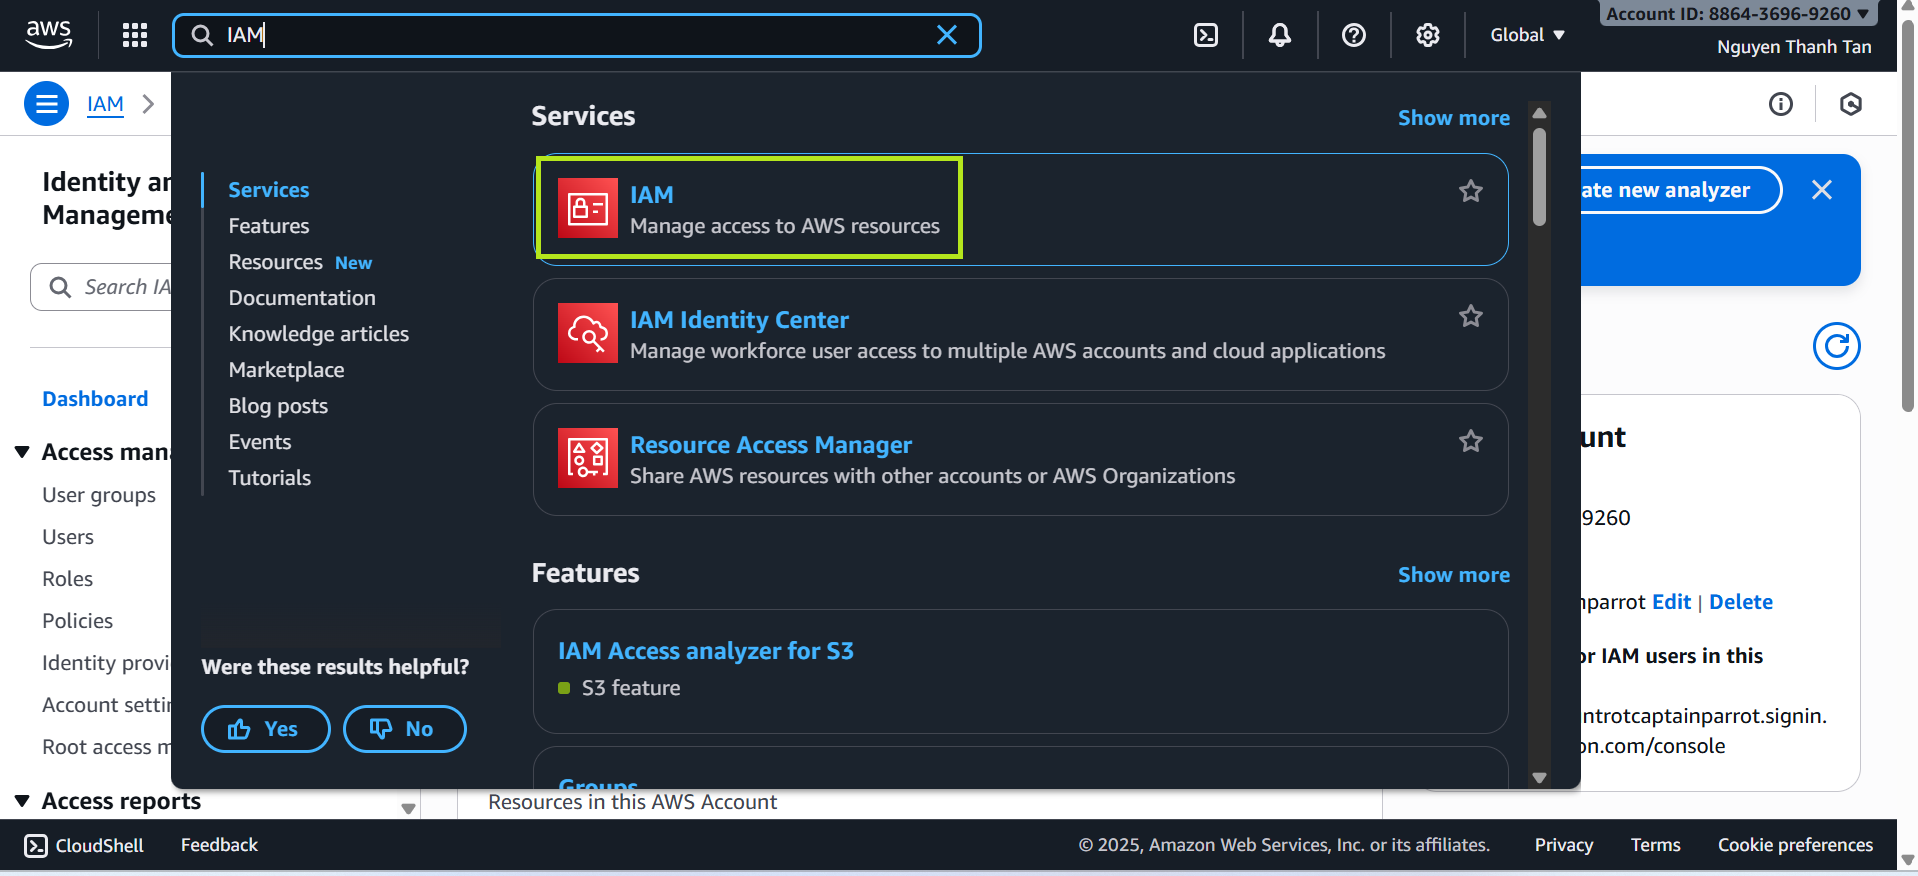
1. Access IAM Service
- Go to AWS Console → IAM
- Select Roles → LambdaAPIAccessRole
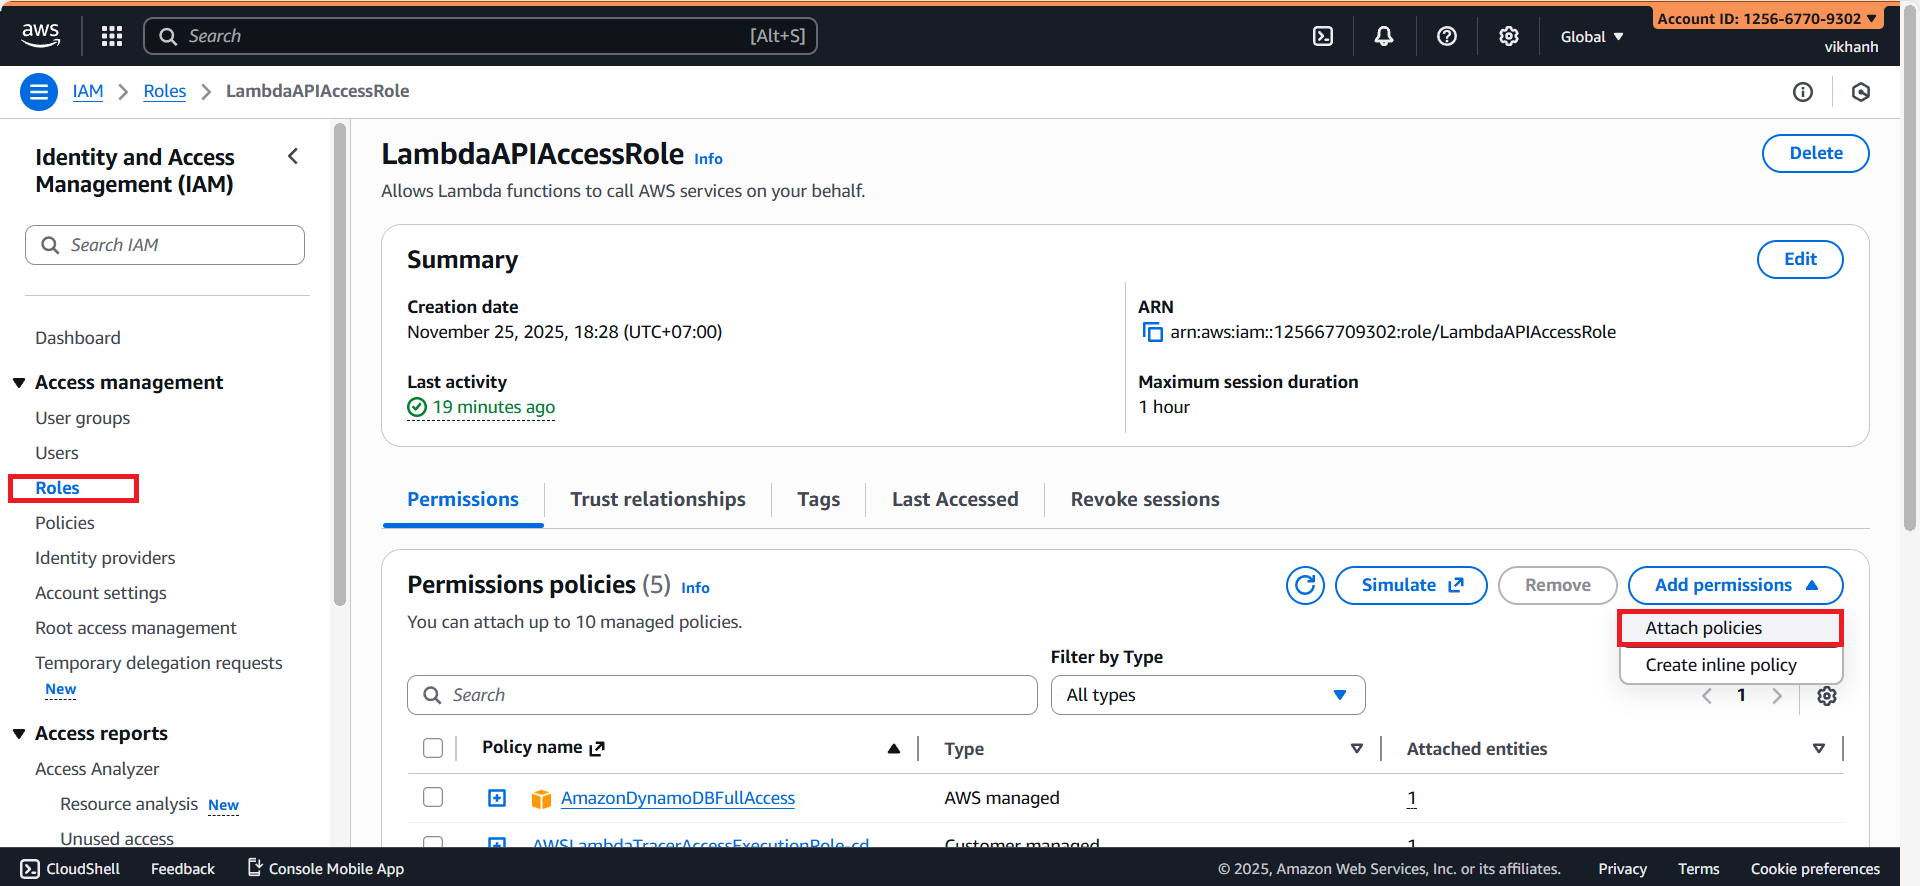
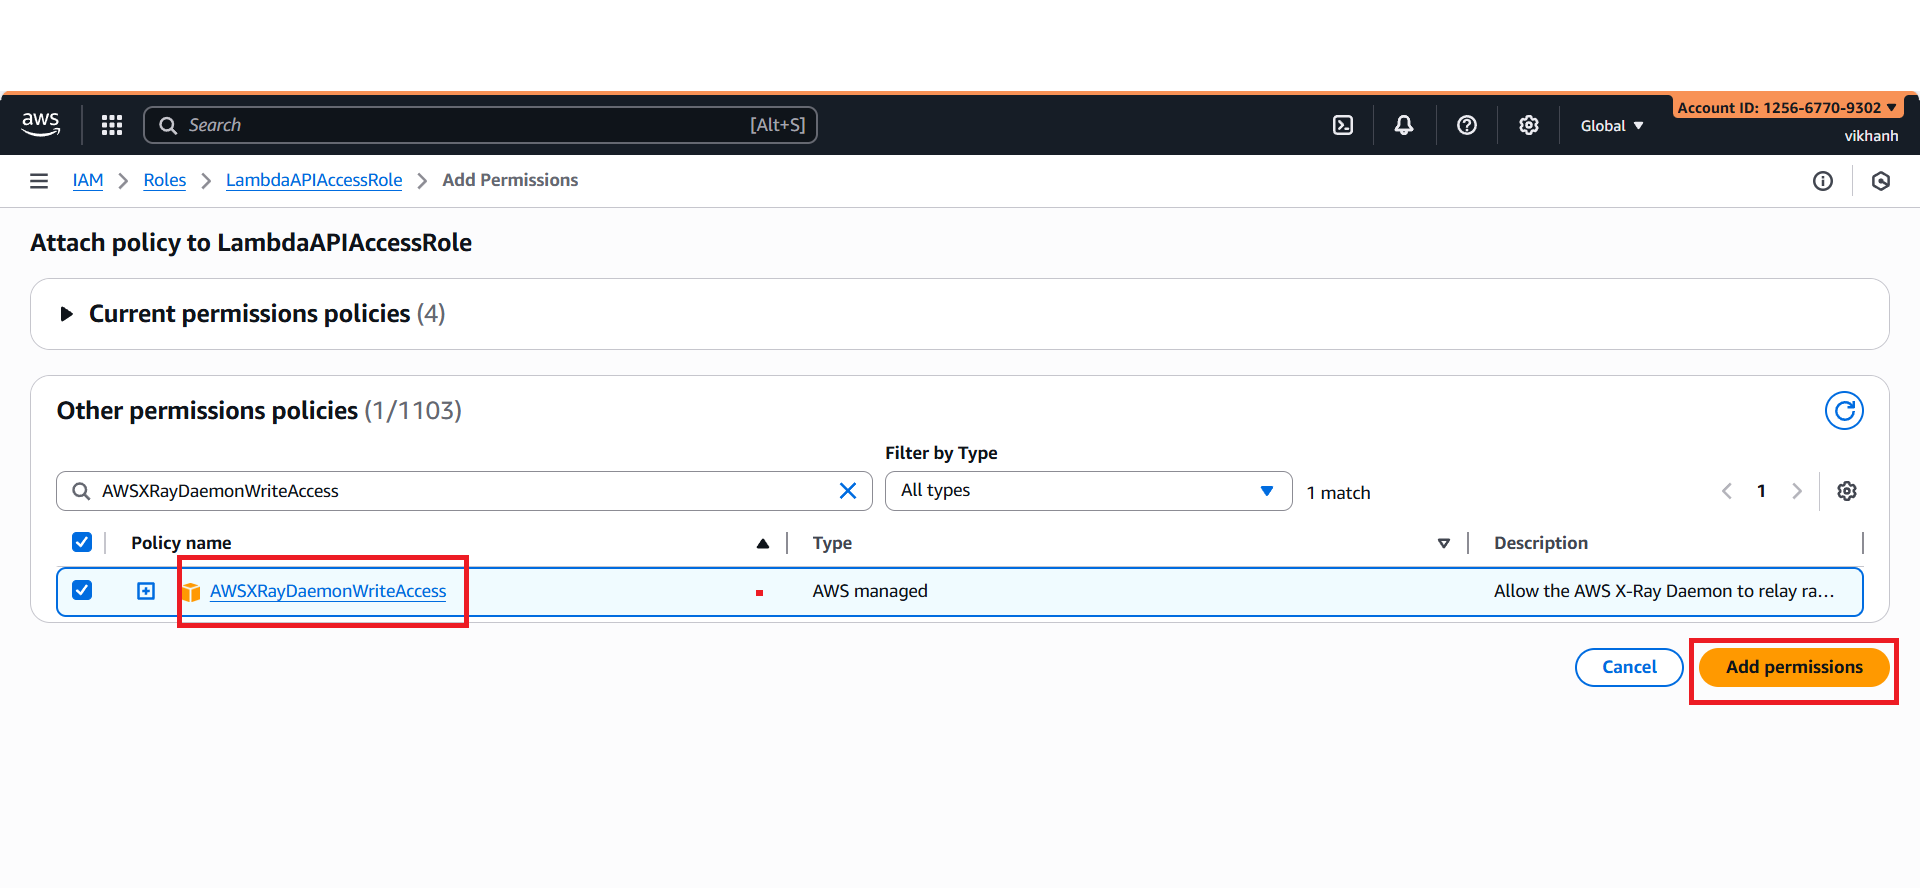
- Choose Add permissions → Attach policies → AWSXRayDaemonWriteAccess
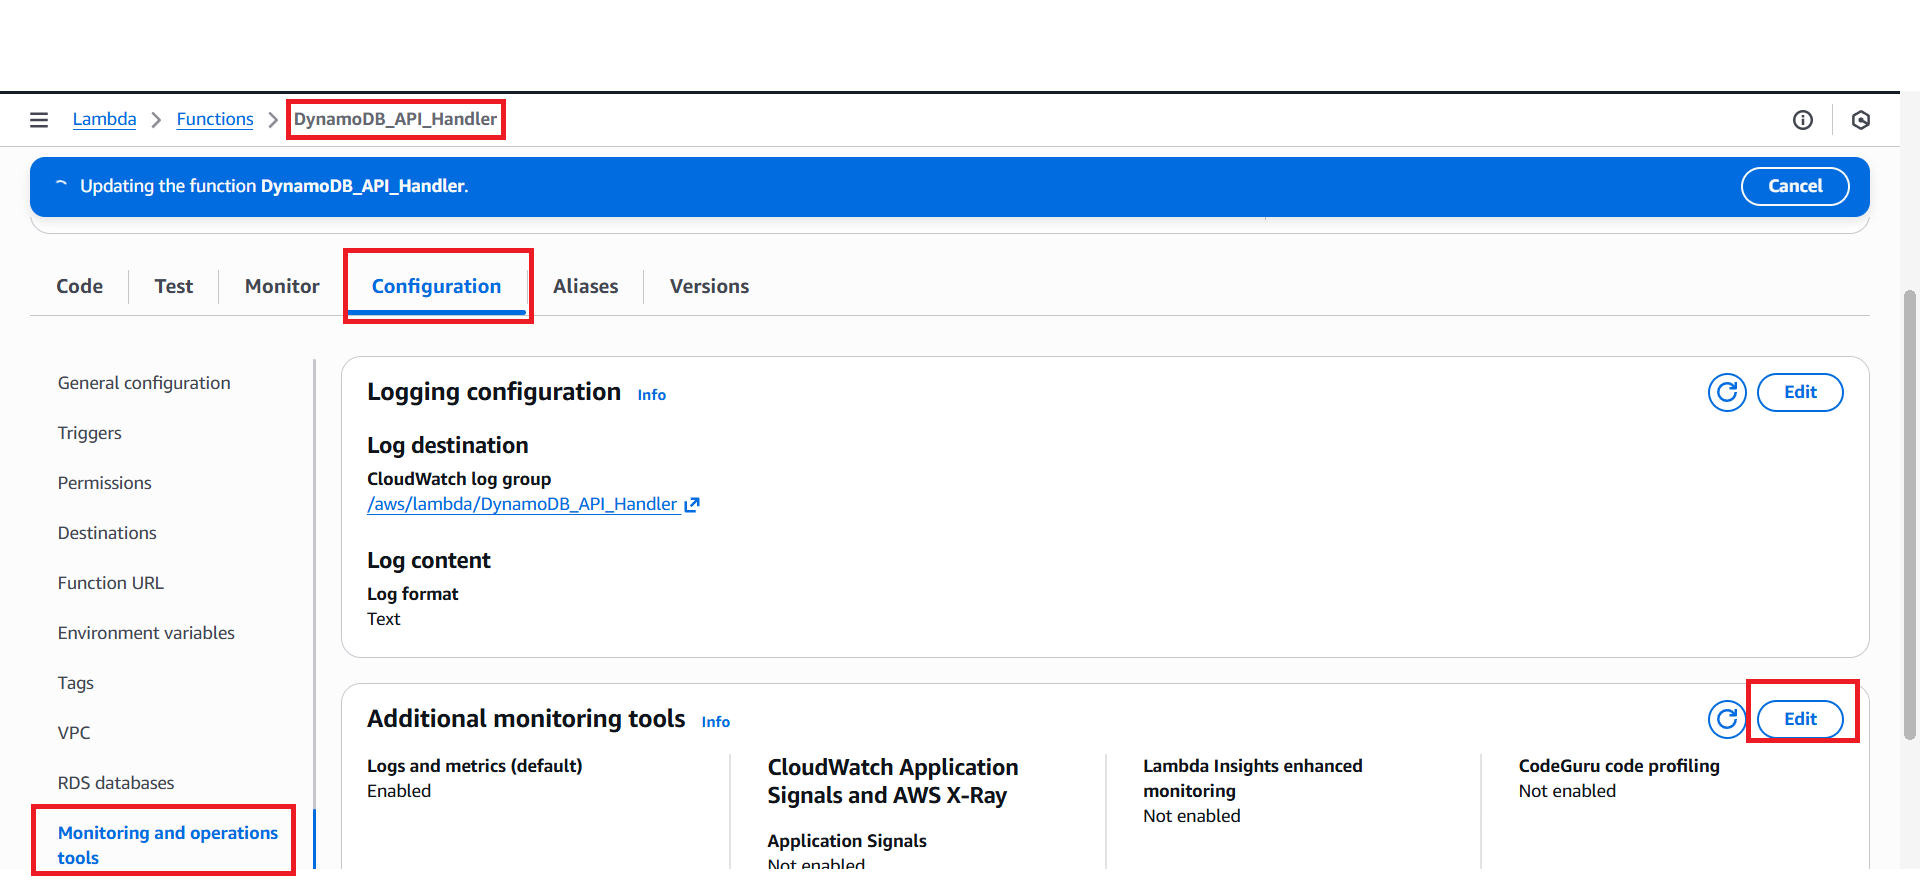
2. Access Lambda
- Go to AWS Console → Lambda
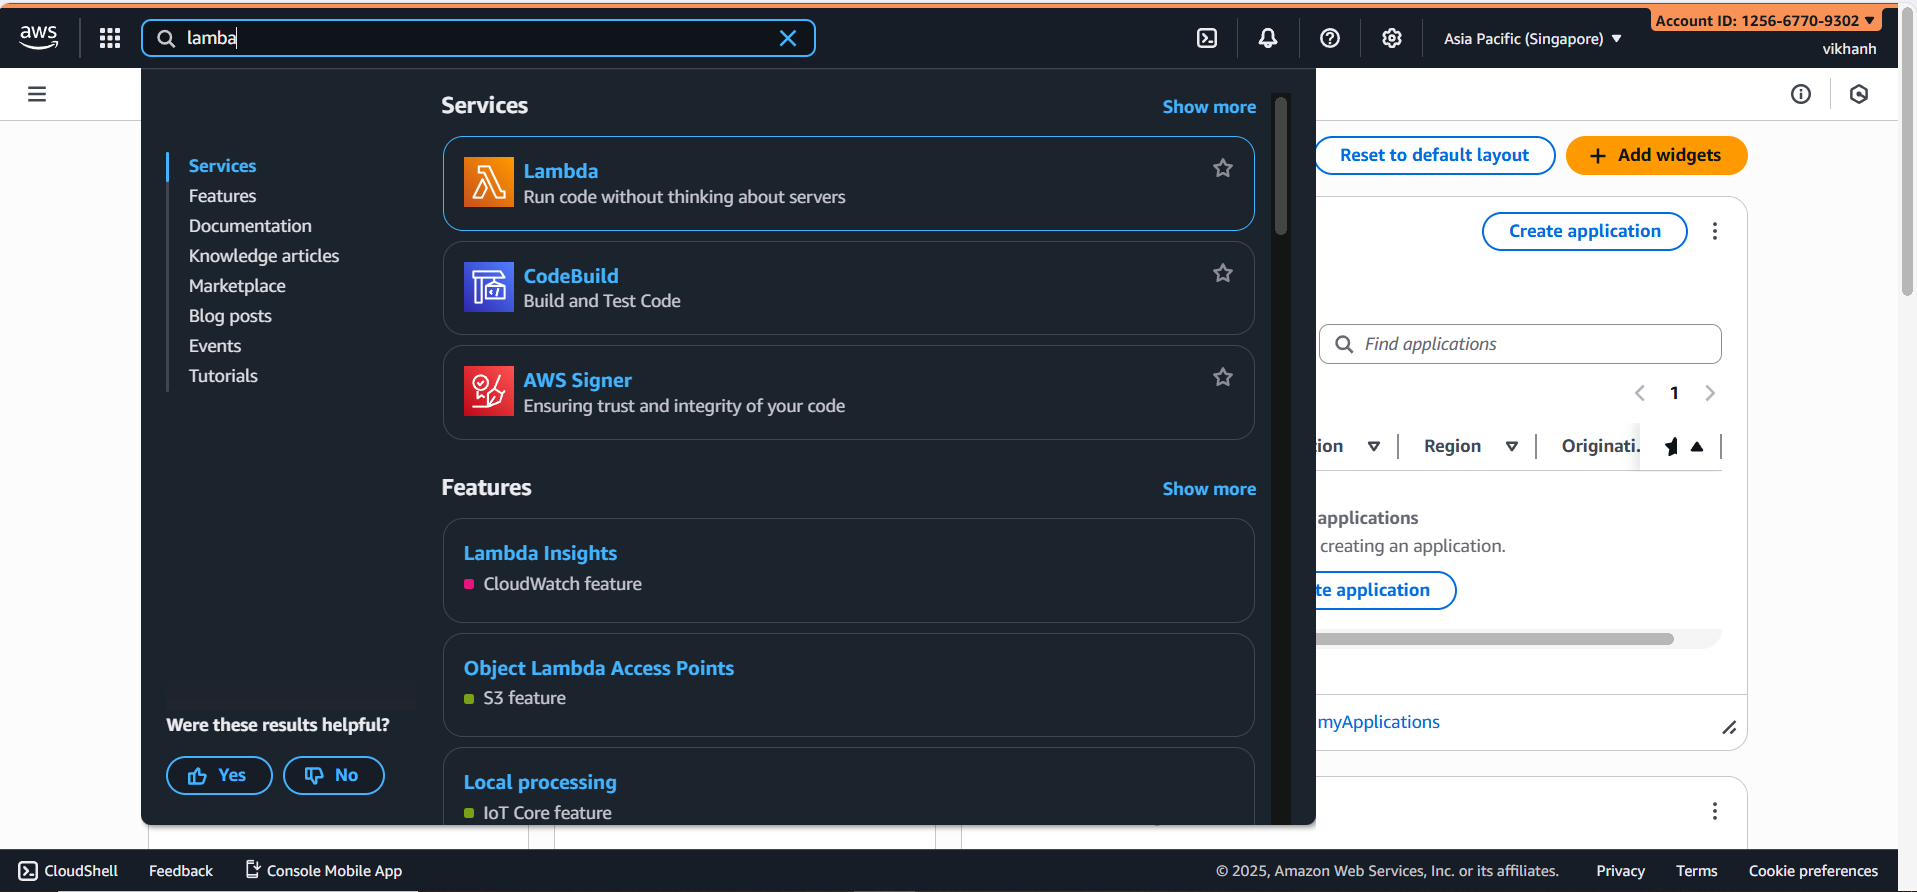
- Select Functions → DynamoDB_API_Handler
- Go to
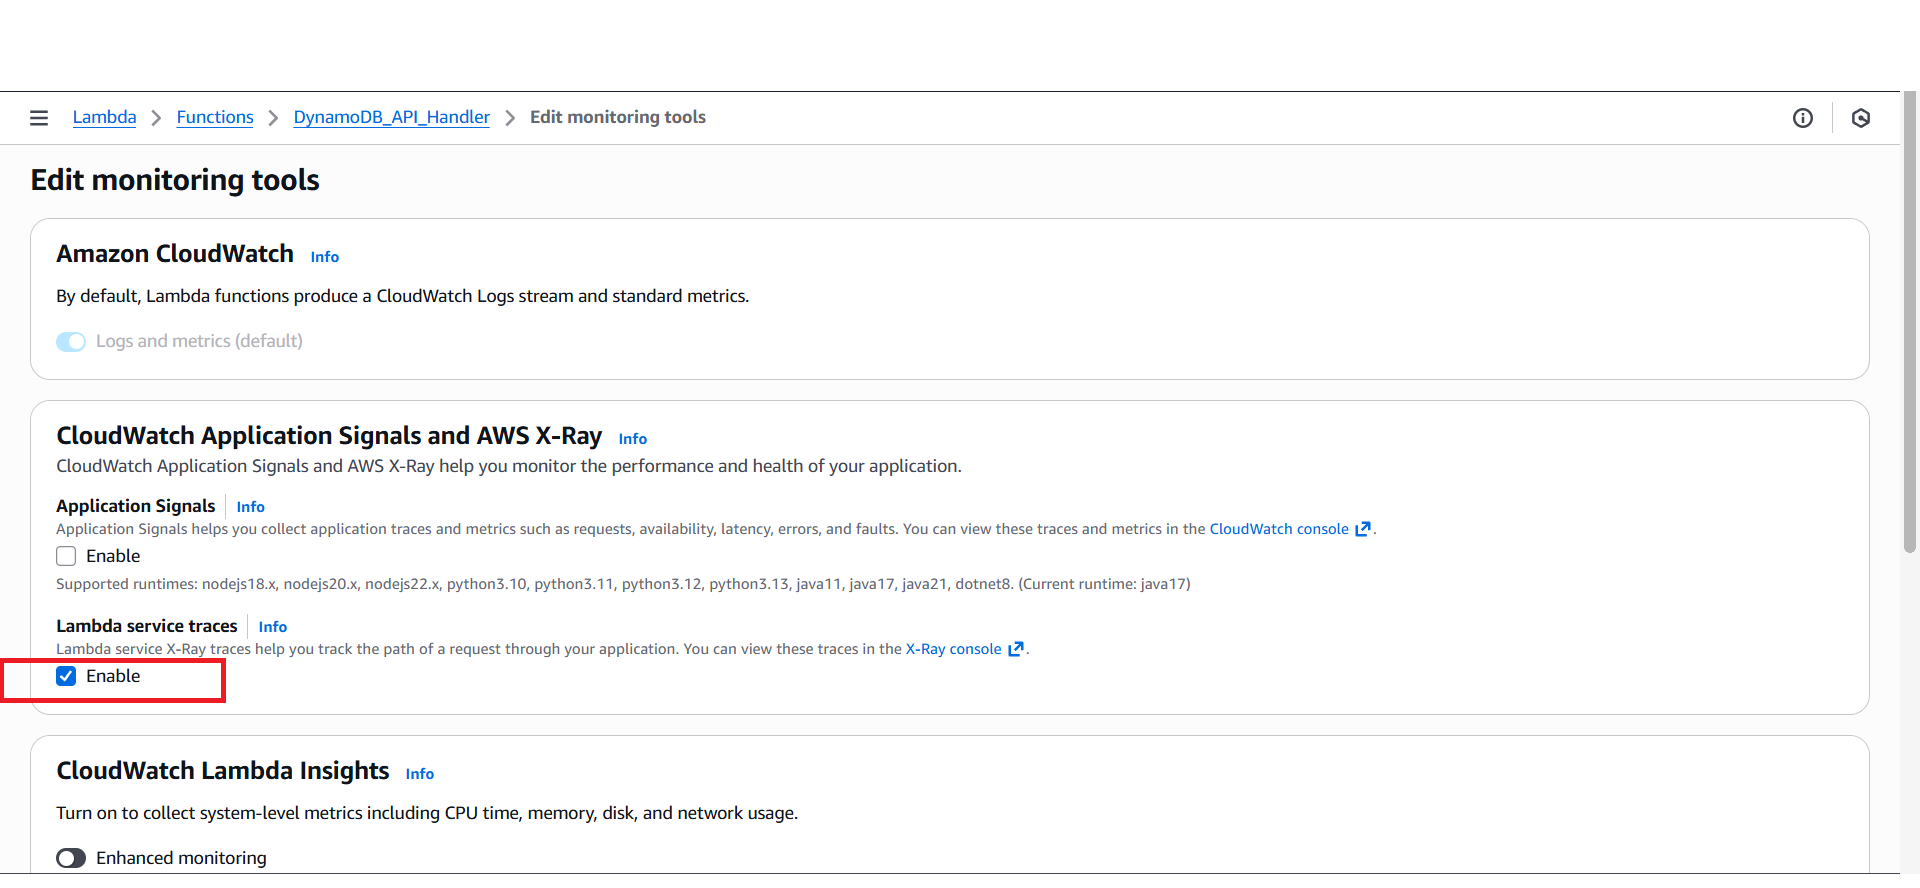
Configuration → Monitoring and operations tools → Additional monitoring tools → Edit
- Under Lambda service traces, enable Enable
3. Access API Gateway
- Go to AWS Console → API Gateway
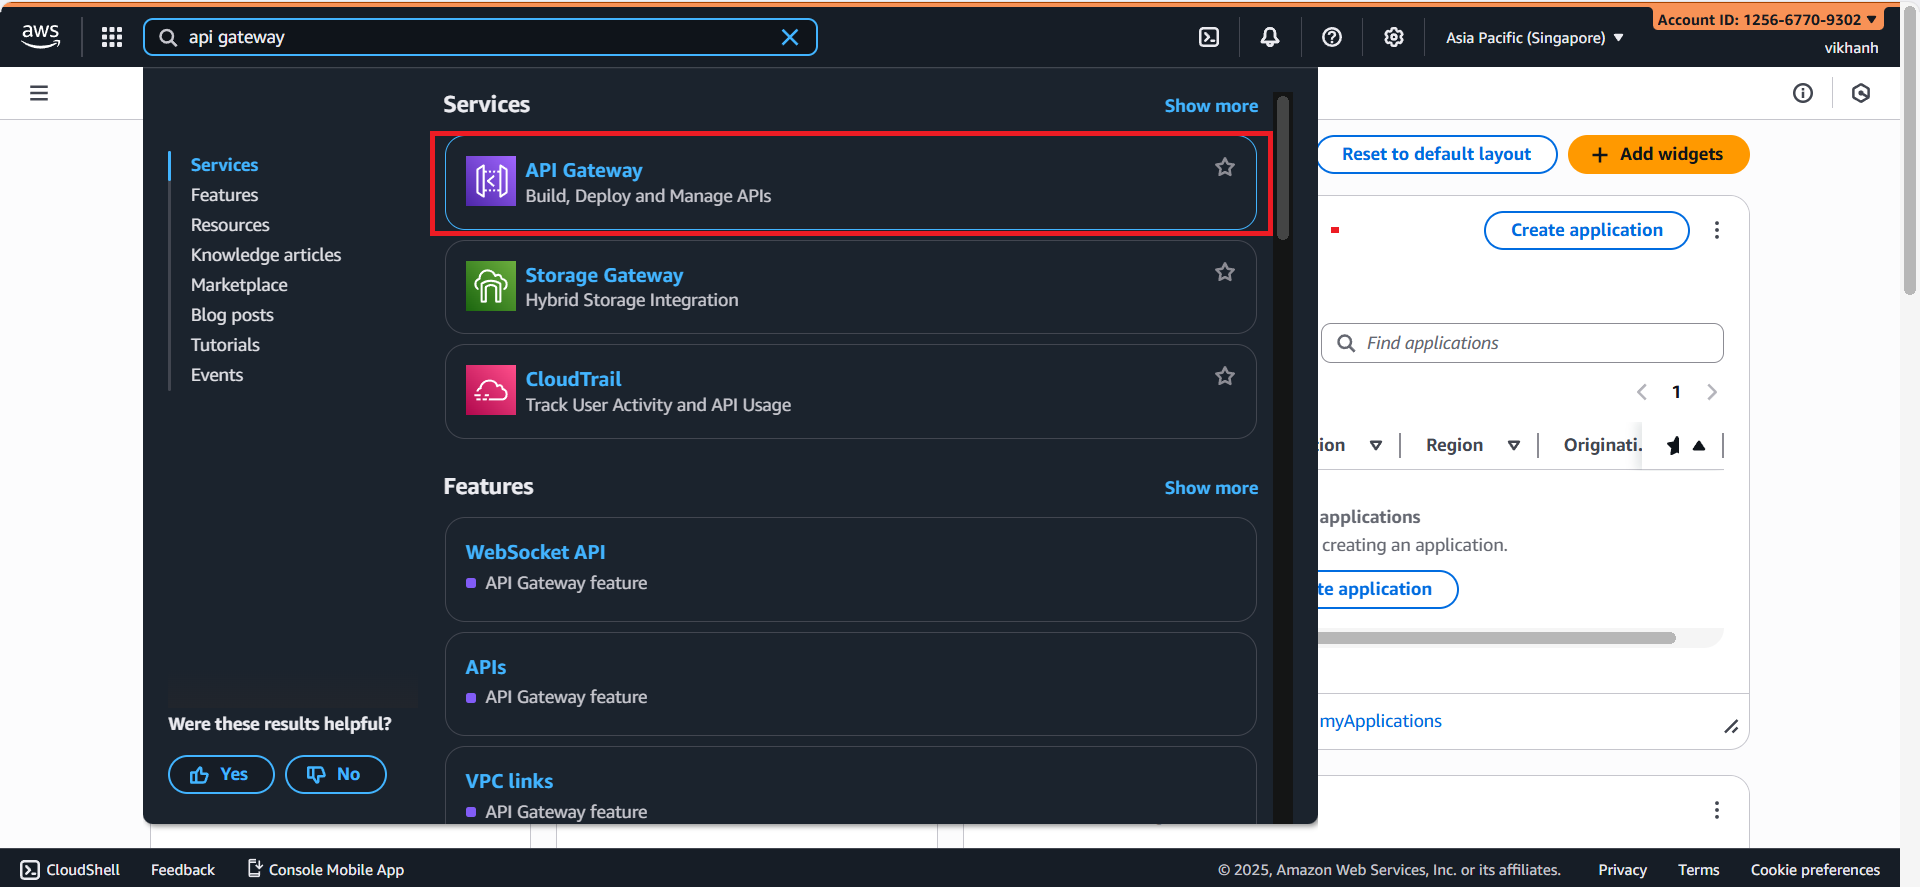
- Select APIs → FlyoraAPI
- Go to
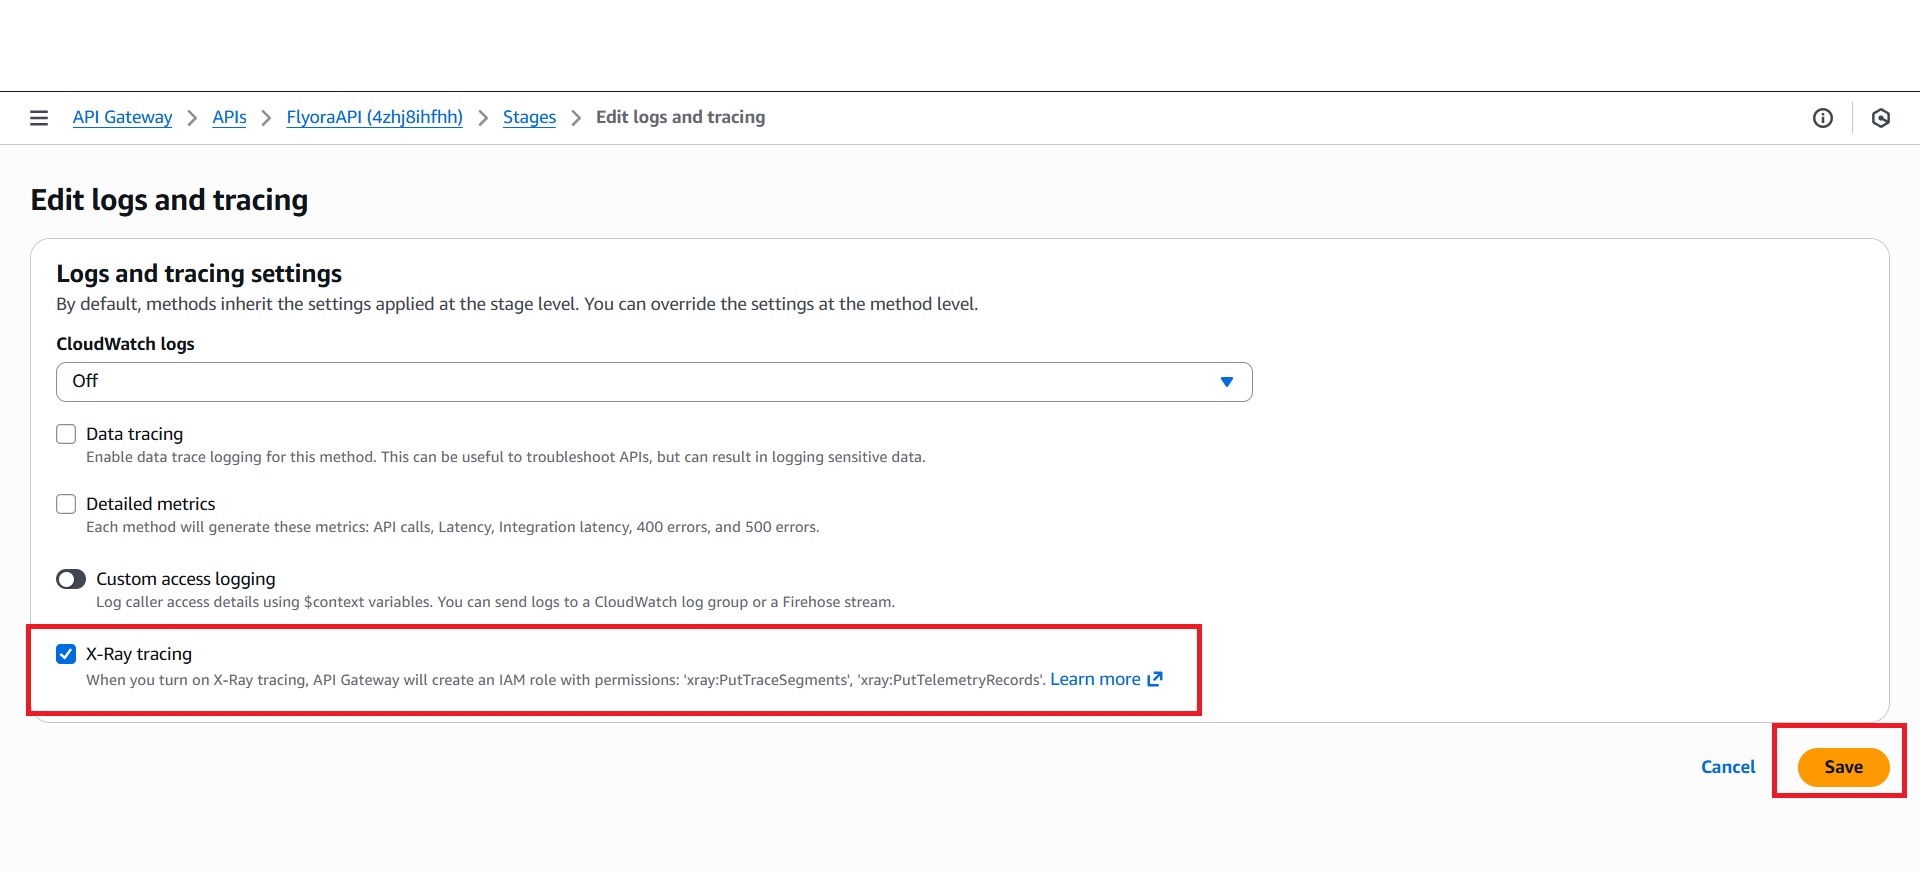
Stages → Logs and tracing → Edit
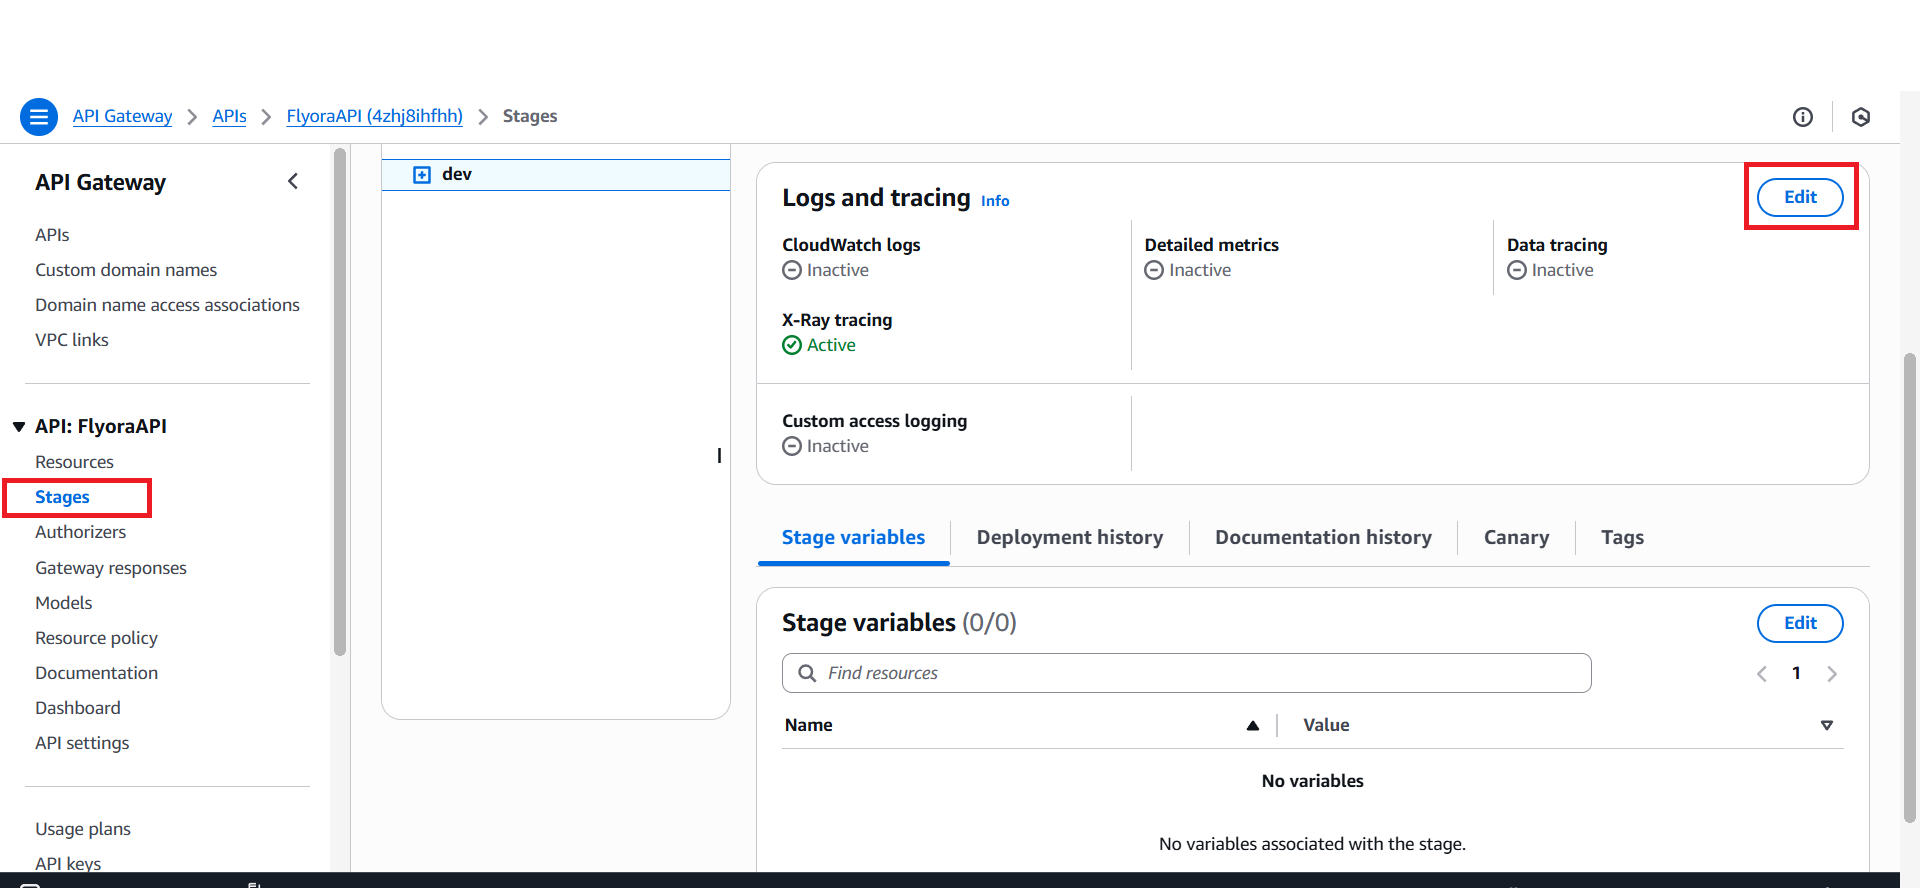
- Check X-Ray tracing
4. Testing
- Go to AWS Console → Lambda
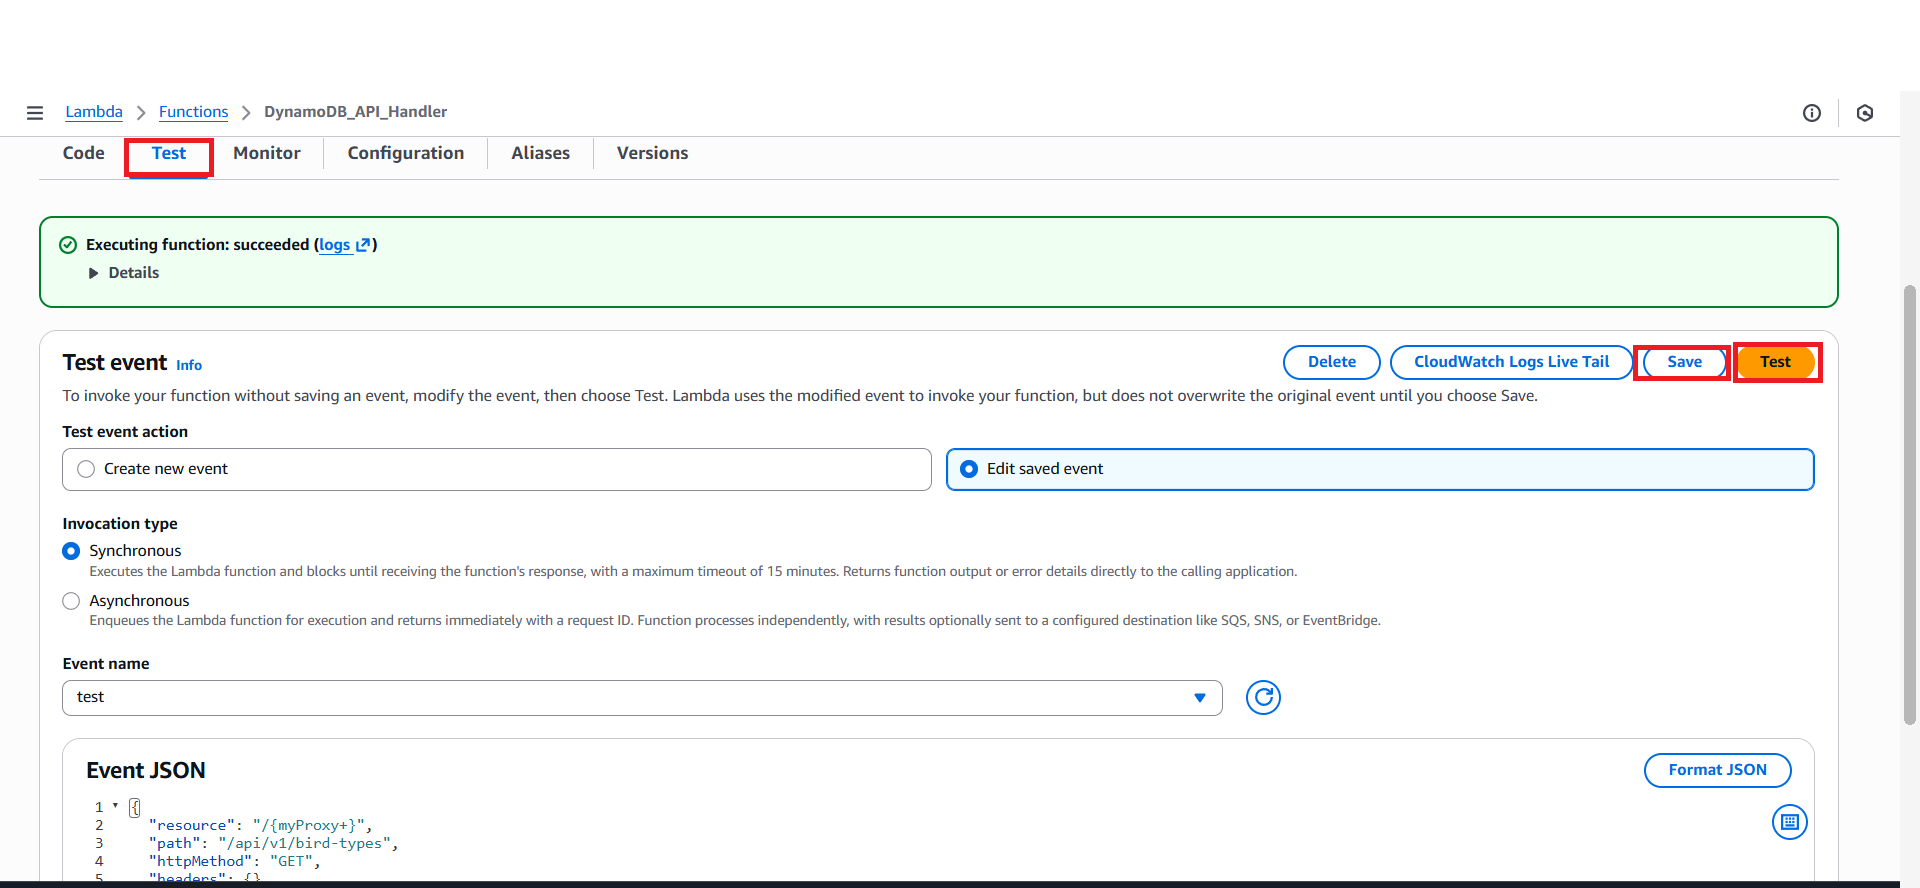
In the Test tab, click Create new event
Event name: test
Paste the JSON below into the event:
{
"resource": "/{myProxy+}",
"path": "/api/v1/bird-types",
"httpMethod": "GET",
"headers": {},
"multiValueHeaders": {},
"queryStringParameters": {},
"multiValueQueryStringParameters": {},
"pathParameters": {},
"stageVariables": {},
"requestContext": {
    "identity": {}
},
"body": null,
"isBase64Encoded": false
}
Save -> Test
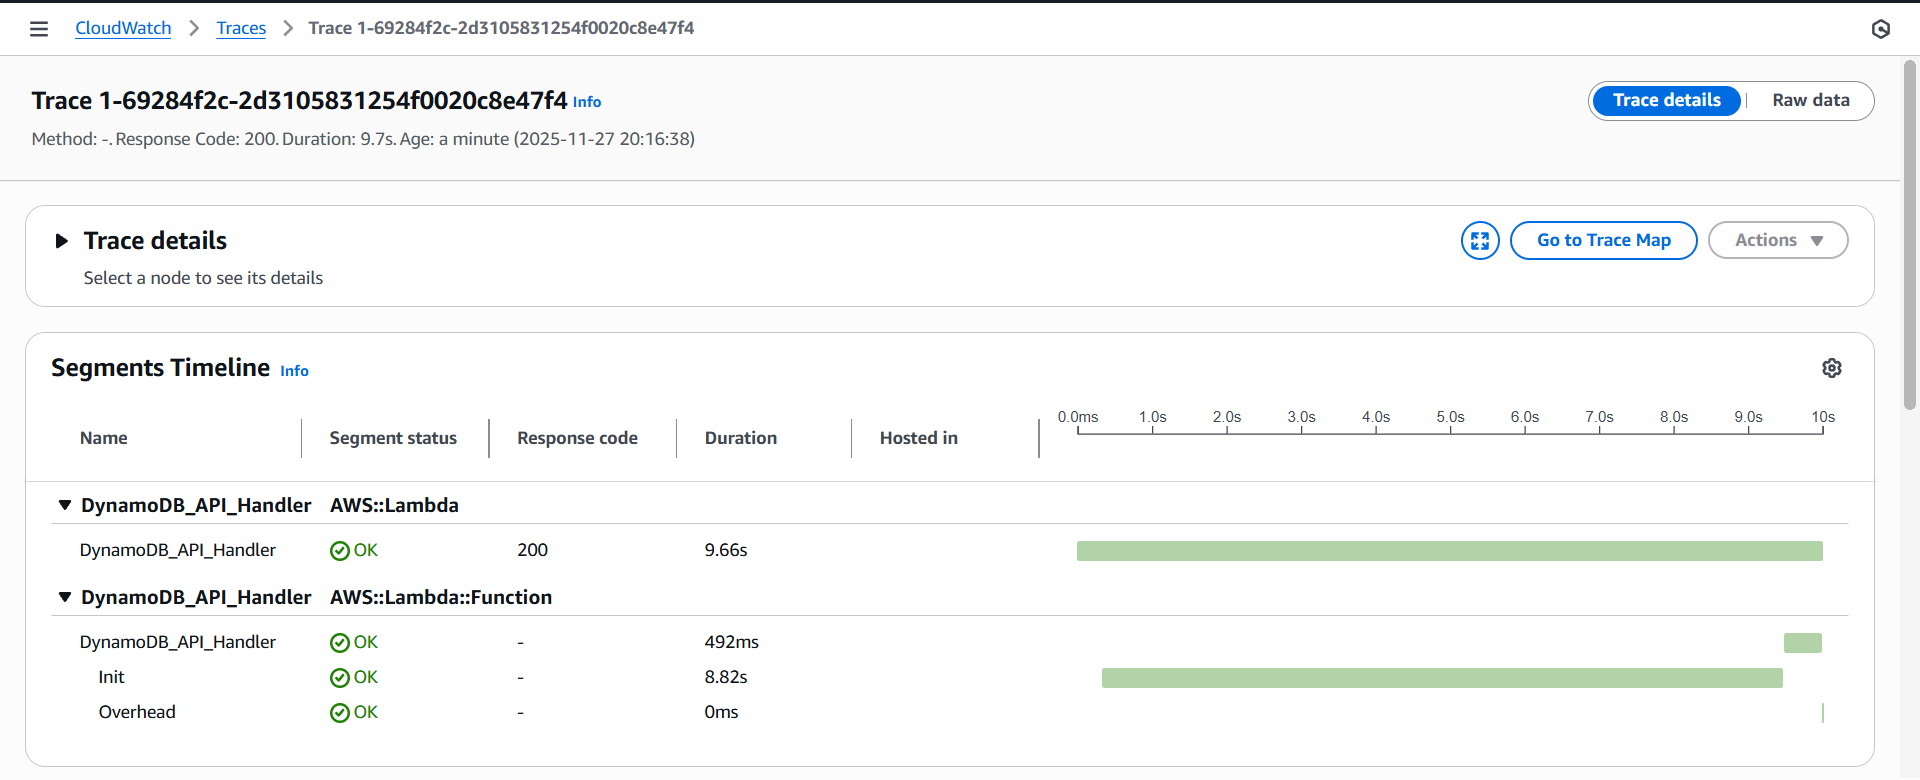
Next, go to AWS Console → X-ray

In tab Traces, a new trace ID will appear
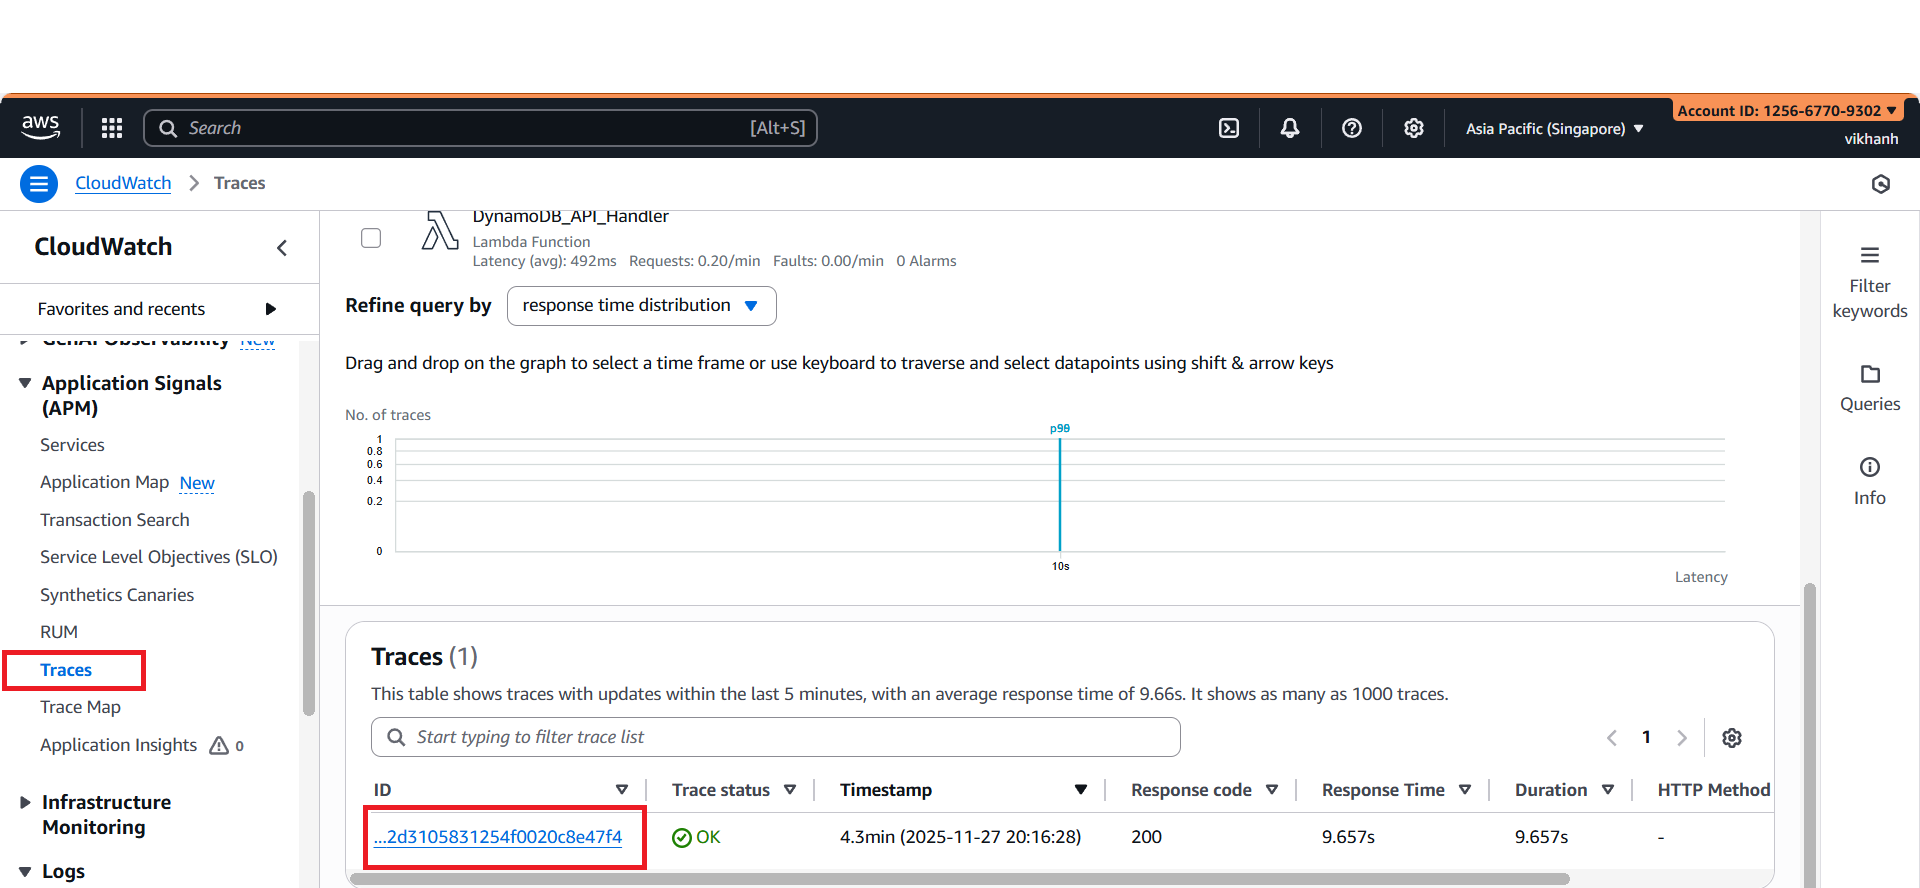
Click it to view detailed trace information